5dchart 2.5

A multi-dimensional data visualization tool for Microsoft Excel
Rating
Your vote:
Latest version:
2.5 See all
Developer:
System Approach, Ltd.
Screenshots
1 / 1
Awards (1)
Show all awards
Software Informer Virus Free award
Trusted Download
6.4 MB

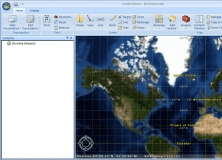
5dchart is a multi-dimensional data visualization tool for Microsoft Excel. It allows you to display a 3D bubble chart with the additional parameters: 3D coordinates of each bubble and bubble size and color. You can also use it to draw bubble projections, projection lines, control axis appearance and axis pane style, etc.

Comments

User

Your vote:

Related software

EDraw Organizational Chart
rating

Edraw lets you draw various types of organizational charts.

Win PDF Editor
Win PDF Editor
rating

Win PDF Editor lets users modify and edit PDF document content.

ArcGIS Explorer Desktop Projection Engine Expansion Pack
ArcGIS Explorer Desktop Projection
Free
rating

It adds projections and geotransformations for use with ArcGIS Explorer Desktop.

Org Chart Creator
Org Chart Creator
rating

Create organizational charts and automate the design process with quick buttons.

Rich Chart Builder
Rich Chart Builder
rating

This transforms your data charts into enjoyable and captivating communication.